
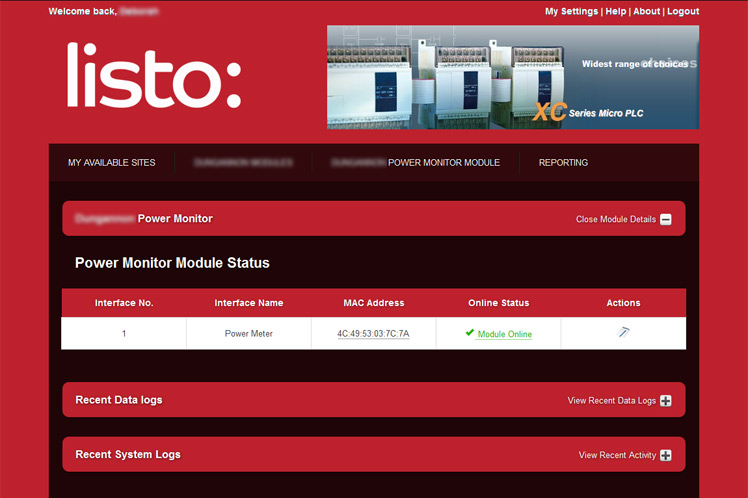
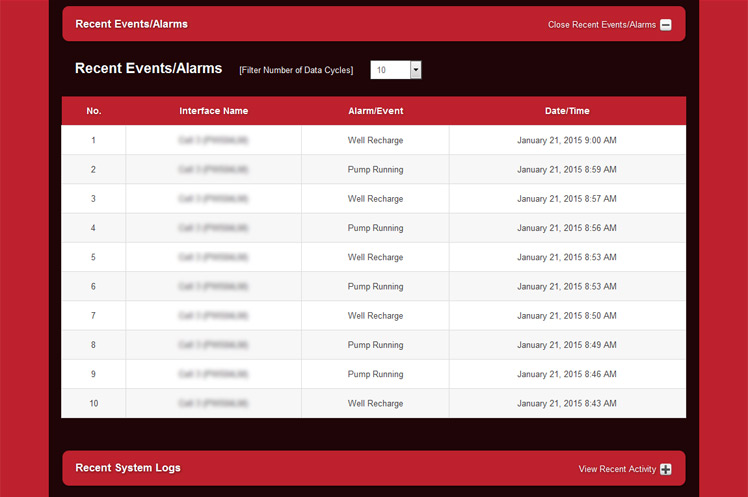
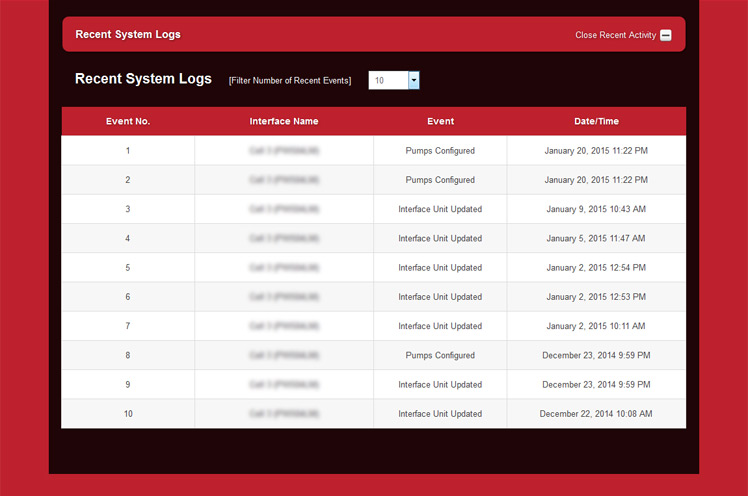
The Listo:Portal is an intuitive Web Interface that manages storage of collated data on the 'Listo:Portal Cloud'. Information is harvested by our intelligent Interface Modules or customer equiment and transmitted to the cloud. 'Alarm' notifications are forwarded by E-mail or SMS to recipients; 'Events' such as Alarms and pump status changes are logged on the portal for historical reporting.
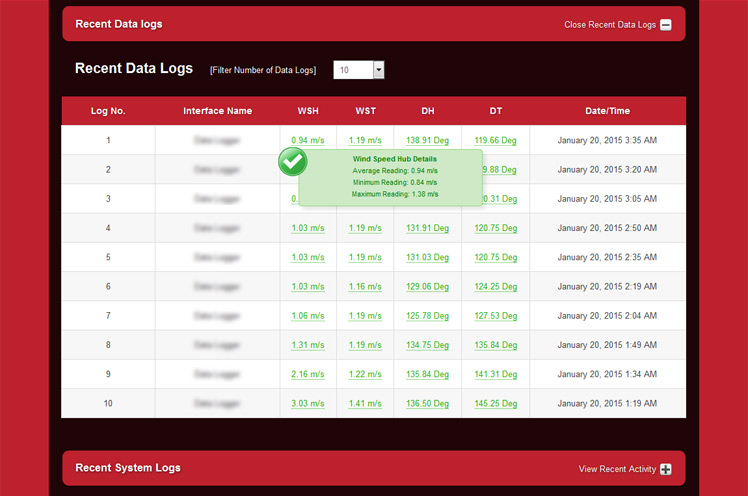
Stored data such as logging and status information can then be securely viewed via the internet on any web-enabled device to allow user-friendly real-time observation and interrogation of information. The system offers users full control of numerous settings via the portal including but not limited to:
Through an intensive R&D programme and end-user collaboration we have designed a comprehensive yet straightforward viewing platform for all our customers. Listo offers complete hardware, software and support packages for monitoring, control and reporting systems.
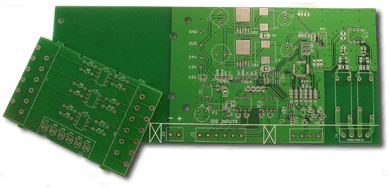
Listo design and manufacture our own PCBs, enabling us to build a catalogue of dedicated hardware and supplementary products to interface with Customers' existing equipment to ready data available for collection and upload to our Listo:Portal cloud servers. With on-going development, support and continuing system upgrades we offer a fully future-proofed monitoring and reporting package for the end-user.


Monitoring of Signals![]() View More
View More
Equipment Status![]() View More
View More
Maintenance![]() View More
View More
Gauges![]() View More
View More
Large Screen![]() View More
View More
Power Monitoring![]() View More
View More
Utility Usage![]() View More
View More
SMS/Email Alarm![]() View More
View More
Downtime Escalation![]() View More
View More
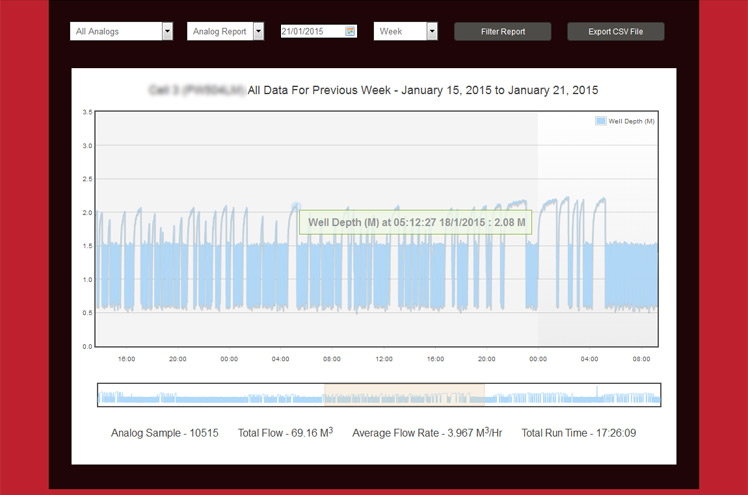
Trending![]() View More
View More